Continuous temperature monitoring in real operating environments
These deployments show how P20 connected wearable sensing with hospital workflows, venue operations and multi-site coordination — and what measurably changed for the teams running them.
Hospital deployments
How wards replaced scheduled spot checks with continuous curves — including one deployment with fully measured results.
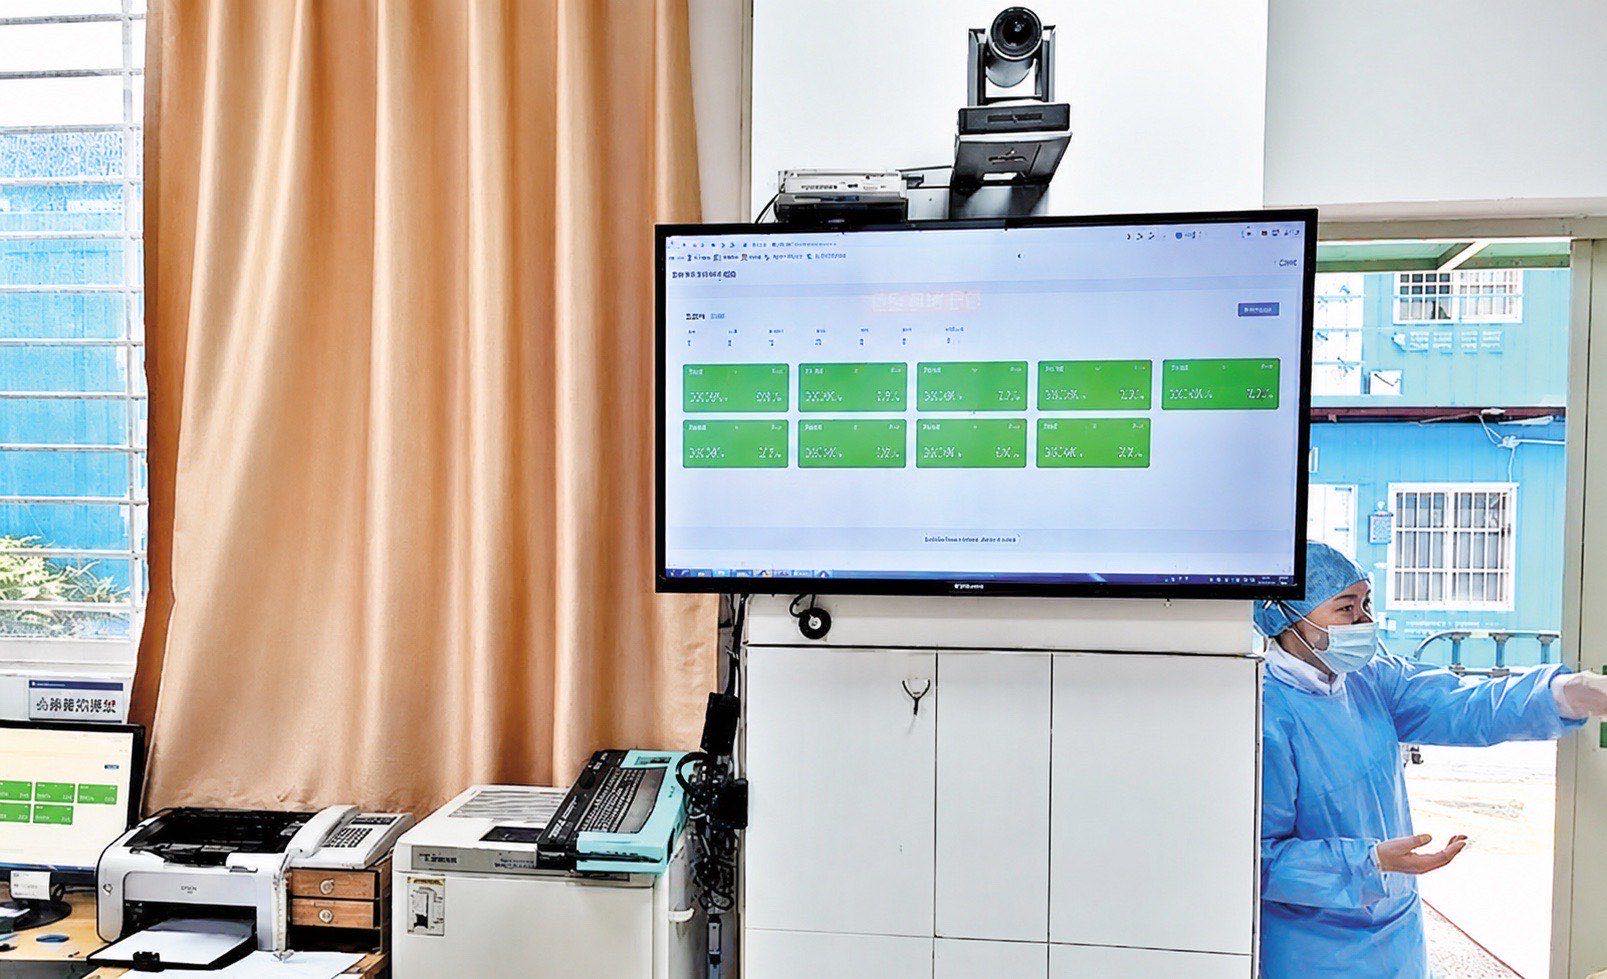
About 91 staff hours saved through HIS-integrated monitoring
183 patients and 50,000+ valid readings at three-minute intervals — selected as a People’s Daily 2020 top-10 healthcare digitalization case.
Read the HIS integration case study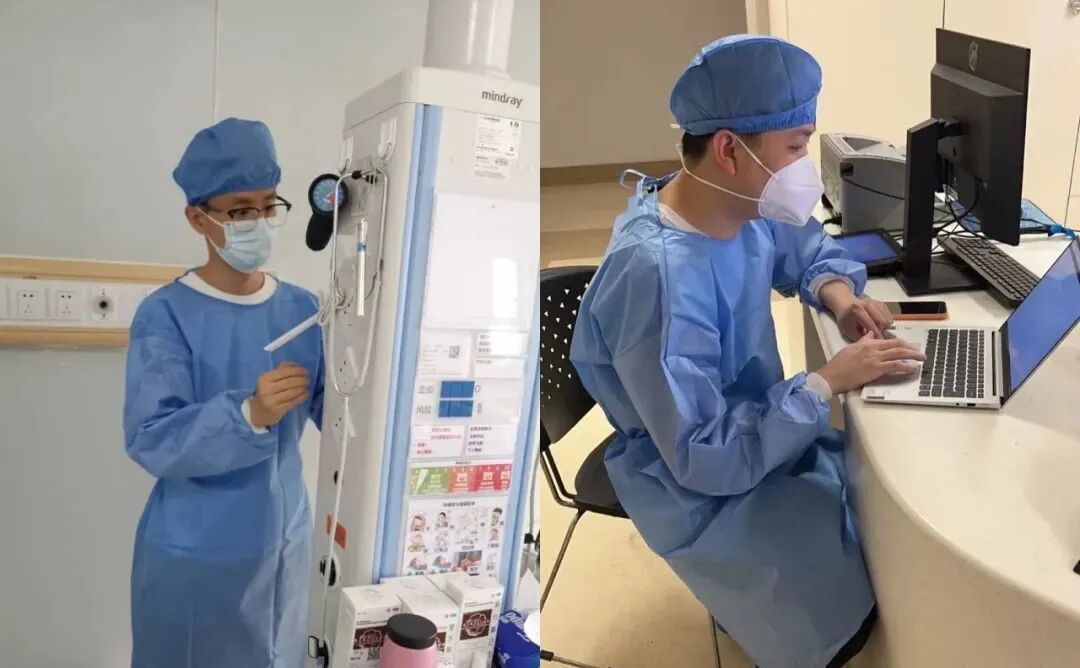
One central view across multiple departments
Wearable group monitoring turned routine observations into a continuous, research-ready clinical record.
Read the multi-department case study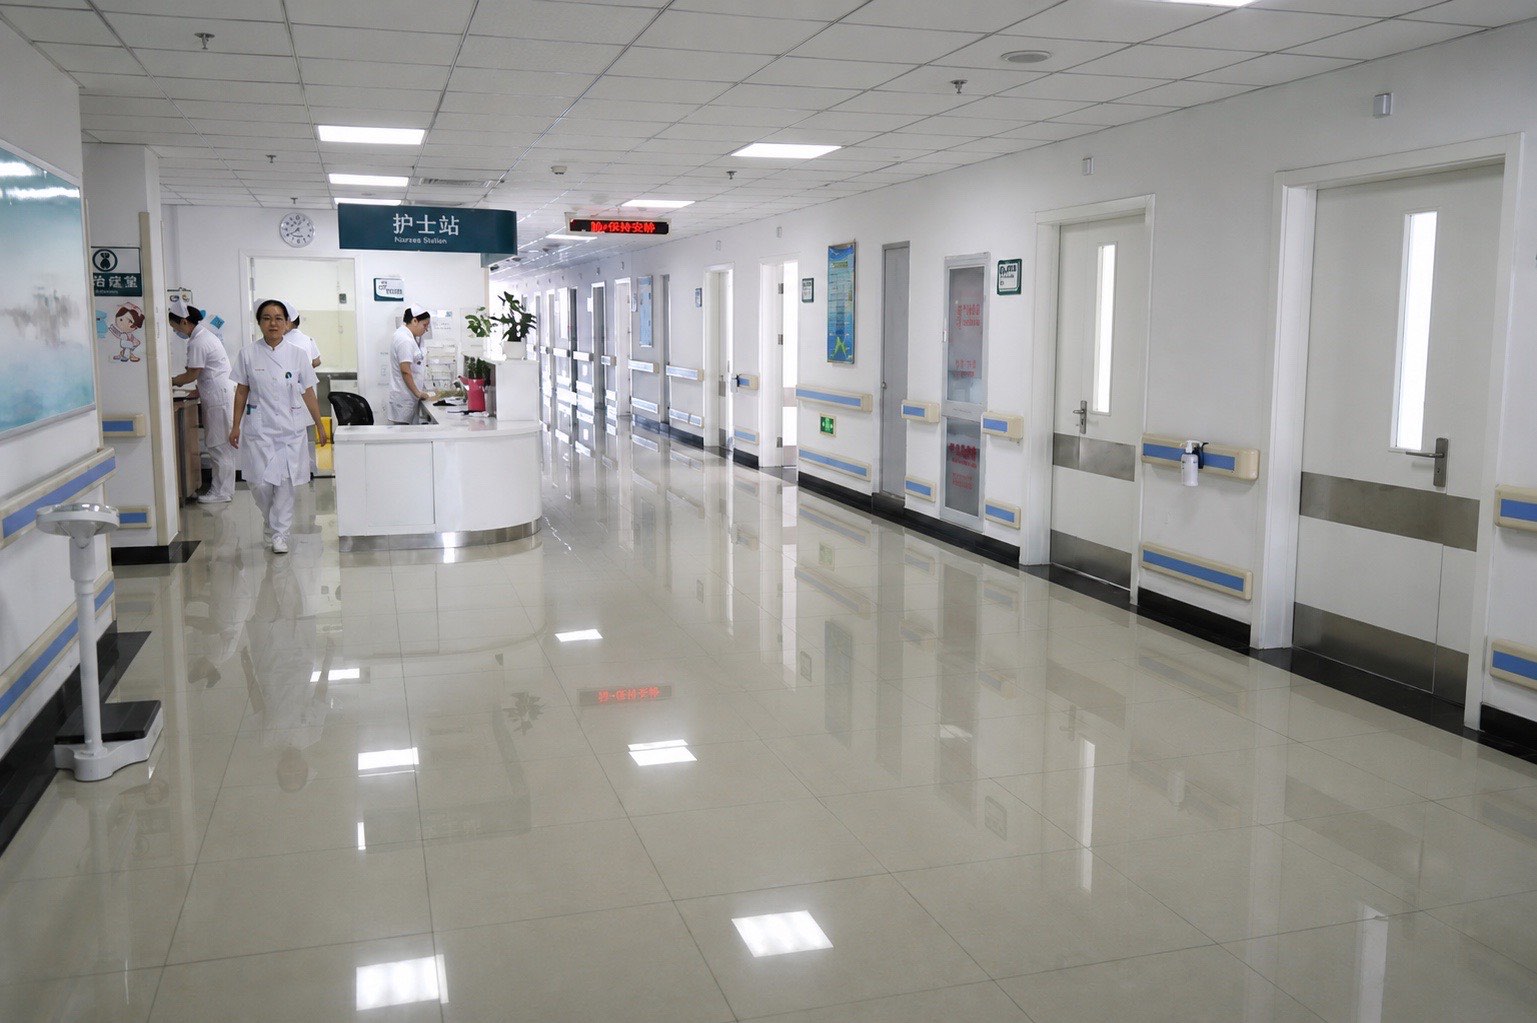
A complete 24-hour curve for every monitored patient
A button-sized underarm sensor and Bluetooth gave nurses the same live temperature curve on three screens.
Read the 24-hour curve case studyEvent & multi-site deployments
The same wearable-plus-gateway architecture, scaled to a Games venue and a 50+ location network.
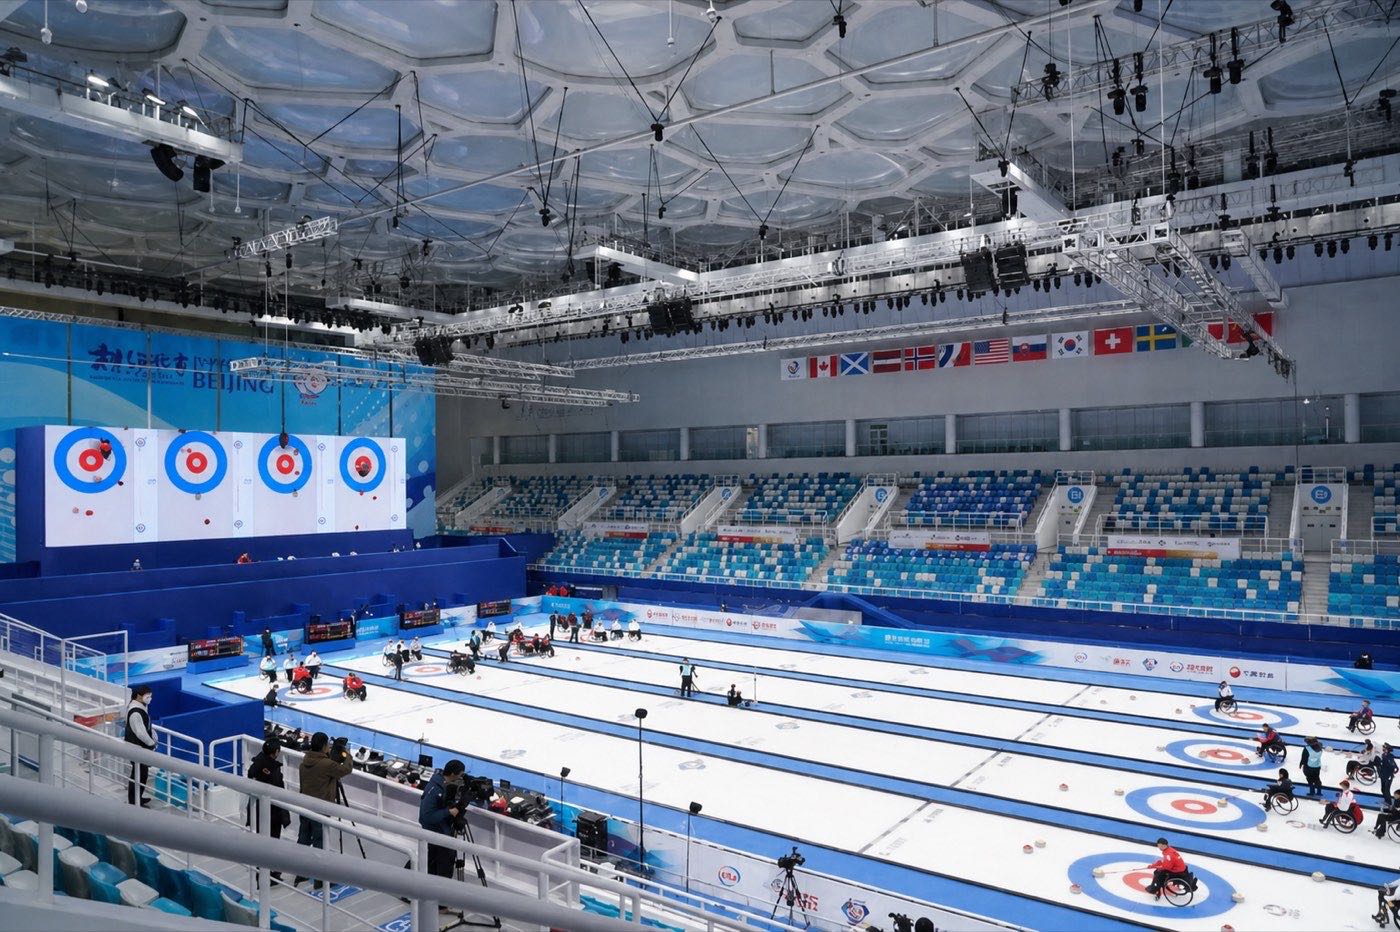
30 days of continuous monitoring behind a Games venue
Three-second sampling and automatic alerts for staff and volunteers — recognised in a letter of appreciation from the venue operations team.
Read the event case study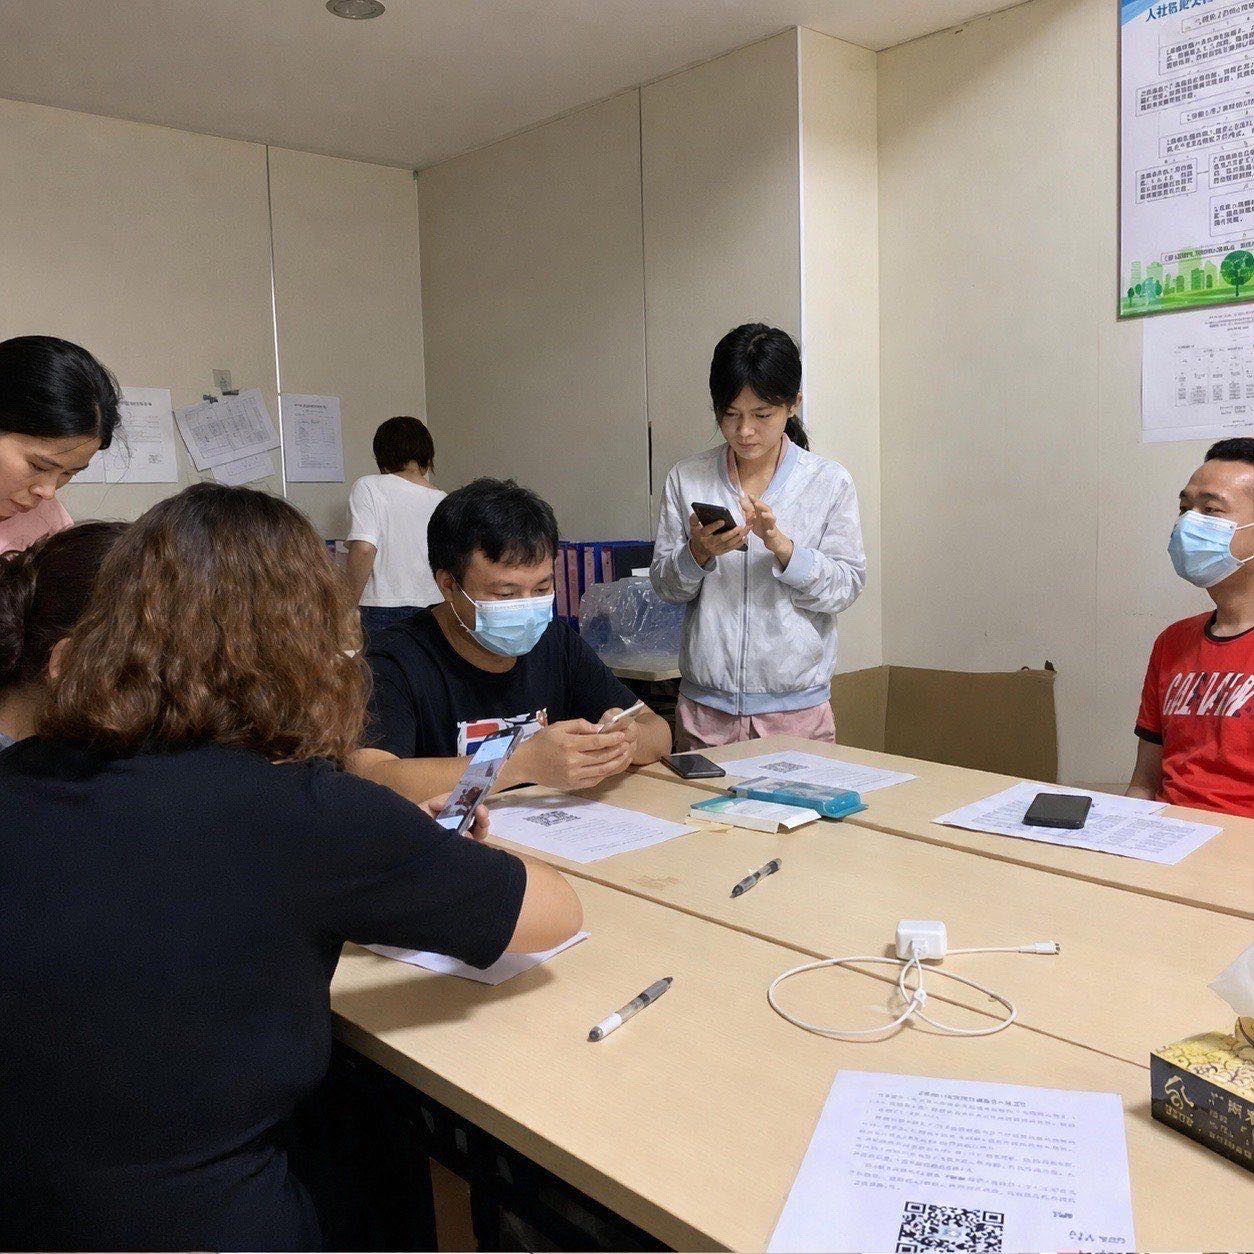
50+ locations connected to one monitoring view
A repeatable field rollout gave a distributed network one centralized continuous temperature monitoring view.
Read the multi-site case study